Approved Grants by Population
- 20 Sep 2023
- Contributors


- Print
- DarkLight
- PDF
Approved Grants by Population
- Updated on 20 Sep 2023
- Contributors
- Print
- DarkLight
- PDF
Article summary
Did you find this summary helpful?
Thank you for your feedback
Approved Grants by Population
This chart provides a stacked view of your Grants by Population code over several years. Each stack adds up to 100% of your Grants for that year.
Data Grid Setup
In (Grantee and Grant Management) Application History, create and save a Data Grid view that contains (at least) the following:
Table: AppHistory
Columns:
- (AppHi) Grant Amount
- (AppHi) Population
Selections:
- (AppHi) Action: From Approved through Approved.
Chart Setup
1. Open the appropriate Data Grid view, and click the FIMS Chart It button.
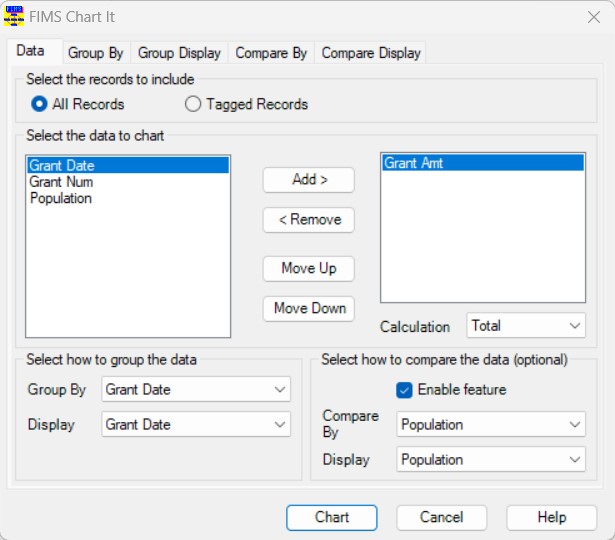
2. On the Data tab, do the following:
- Add the Grant Amt data field to the chart.
- In the Group By and Display drop-downs, select Grant Date.
- Select the Enable Compare checkbox.
- In the Compare By and Display drop-downs, select Population.
Data Tab

3. On the Group By tab, select the Year checkbox in the For Dates, Chart By section.
4. Click the Chart button.
Finished Chart

This chart uses the following settings:
- Stacked 100% (via General Properties).
- Legend (used the Data Editor to change the labels in the legend).
Was this article helpful?