Group Display Tab
- 09 Oct 2023
- Contributors


- Print
- Dark
- PDF
Group Display Tab
- Updated on 09 Oct 2023
- Contributors
- Print
- Dark
- PDF
Article summary
Did you find this summary helpful?
Thank you for your feedback!
Group Display Tab
The Group Display tab allows you to configure what displays for each group by value. In most cases, the Group By data is the same as the Group Display data, but the fields may differ (for example, if you want to group your data by a code value but display the code description).
You can set Group Display options for Date and Boolean (true / false) data fields. There are no group display options for numeric or character fields.
Example: Group Display Tab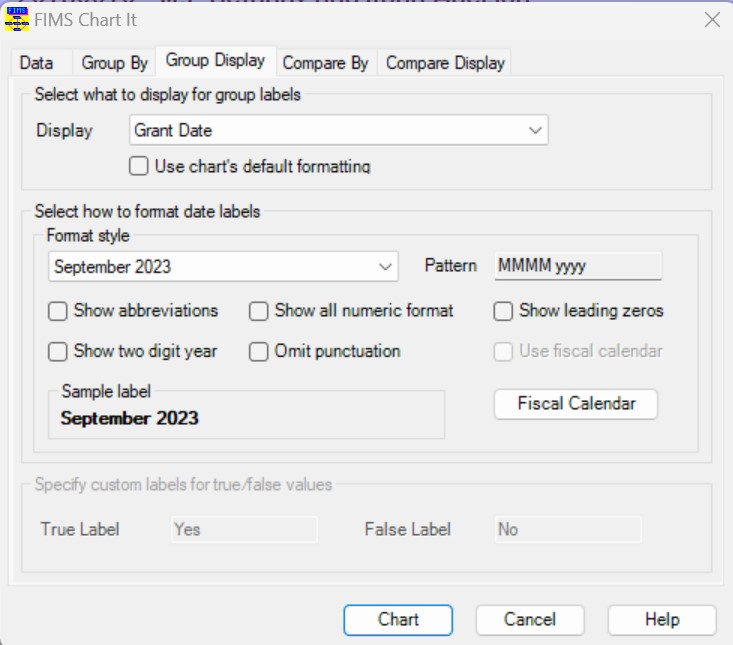
Field | Description |
|---|---|
Display | The data field that you want to use for the chart’s X-axis display values. NOTE: This is the same as the Display drop-down on the Data tab. If you change the data value in this drop-down box, it will also change on the Data tab (and vice-versa). |
Use Chart’s Default Formatting | Checkbox that determines whether you want to use the system’s default formatting for the labels on the X-axis of the chart. Select this checkbox to use the default formatting. If you use default formatting, the other fields on this tab will be disabled. Clear this checkbox if you want to define custom formatting for the chart. For example, if the Display field contains date values, then you can use the Select How to Format Date Labels section to configure the date style you want to use. If the Display field contains Boolean values, you can enter custom values for True and False. This checkbox is cleared by default for date fields and selected by default for Boolean fields. |
Format Style | The list of available date label styles. Click the arrow in the drop-down box to select the style that you want to use for date labels on the chart’s x-axis. NOTE: The available styles may vary based on your Windows regional settings. |
Pattern (Dates) | The format pattern that will be used for the selected Format Style. NOTE: This field is read-only unless you select Custom Pattern (Advanced) in the Format Style drop-down box. If you select Custom Pattern, you can enter your own pattern. Tips for Custom Patterns:
|
Show Abbreviations (Dates) | Checkbox that determines whether you wan to display the full names of months and quarters, or abbreviations. Select this checkbox to display abbreviations or clear it to display the full name. |
Show Two Digit Year (Dates) | Checkbox that determines whether to display a two or four digit year. Select this checkbox to display a two-digit year, or clear it to display a four-digit year. |
Show All Numeric Format (Dates) | Checkbox that determines whether you want to display all dates in numeric format (for example 10 for October or 1 for First Quarter). Select this checkbox to use numeric formatting for all dates, or clear it to use alpha-numeric formatting. |
Omit Punctuation (Dates) | Checkbox that determines whether you want to use punctuation in your date format (for example commas after a spelled out month). Select this checkbox to omit punctuation, or clear it to include punctuation). |
Show Leading Zeros (Dates) | Checkbox that determines whether you want to display leading zeros for numeric months and days. Select this checkbox to display leading zeros, or clear it to remove them. |
Use Fiscal Calendar (Dates) | Check this box to use the fiscal calendar. If you check the “Use fiscal calendar” box on the Group By tab, then the dialog-box automatically checks this box. If you select a format style that contains the fiscal period, then the dialog-box checks and disables this box. If the style displays the period, then this implies the use of the fiscal calendar. |
Fiscal Calendar (Dates) | Select this checkbox if you want to use the fiscal calendar in FIMS to define your date ranges. |
Sample Label (Dates) | Read-only field that displays a sample of how the date will appear on the chart, using the current date using the selected format style and options. |
Specify Custom Labels for True / False Values (Boolean) | The labels that you want to use for True and False values for Boolean data. The label you enter will appear along the X-axis of the chart. |
Was this article helpful?