- Print
- Dark
- PDF
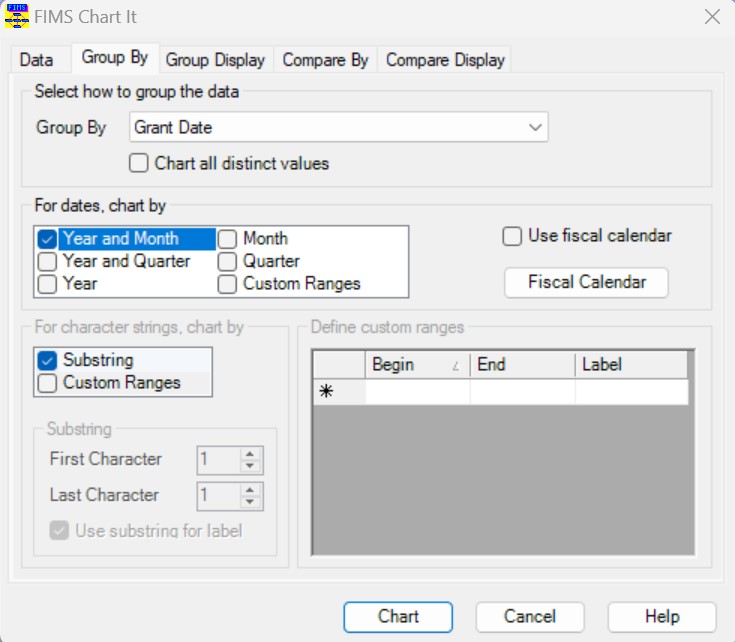
Group By Tab
The Group By tab provides additional grouping options for the chart, depending on the type of data that you are including. For example, there are options for grouping by a data field that contains dates, character string, or numeric values. You can also choose to include all values in the Group By field or define a range of values that you want to include.
NOTE: Group By options are not available for Boolean data (true / false values).
Example: Group By Tab
Field | Description |
|---|---|
Group By | The data field that you want to use to group your data in the chart. You can choose any field that is part of the Data Grid you used as the basis for the chart. NOTE: This is the same as the Group By drop-down on the Data tab. If you change the data value in this drop-down box, it will also change on the Data tab (and vice-versa). |
Chart all Distinct Values | Checkbox that indicates whether you want to display each distinct data value in the Group By data field along the chart’s X-axis. Select this checkbox to chart all values as-is. NOTE: Selecting this checkbox disables the other options on this tab. Clear this checkbox if you want to define the way data is displayed in the chart. For example, if you have selected a date field, you can choose to group the data by year, month, quarter, year and month, year and quarter, or a custom range. NOTE: The checkbox is cleared by default if the Group By field contains a date value. For all other data types, the checkbox is selected by default. |
For Dates Chart By | If you selected a date value in the Group By field, you can use this section to determine the way you want to group the data. There are six available options for charting dates:
NOTE: If you select the Use Fiscal Calendar checkbox, this option changes to Year and Period. |
Use Fiscal Calendar | Select this checkbox if you want to use the fiscal calendar in FIMS to define your date ranges. |
Fiscal Calendar | Click this button to view the fiscal calendar in FIMS. |
For Character Strings Chart By | If you selected a character value in the Group By field, you can use this section to determine the way you want to group the data.
|
Substring | If you selected the Substring checkbox in the For Character Strings Chart By section, use this section to define the character positions for your substrings:
NOTE: Selecting this checkbox disables the options on the Group Display tab. |
| Define Custom Ranges | Use this section to create a set of custom grouping ranges for date, character, or numeric data (for example, you can define the set of numeric ranges: 0-100,000, 100,001-500,000, and 500,001+). The chart will only include data that fits within the specified ranges and will ignore all other data. You can enter ranges in any order. After you enter a range, the system will automatically re-sort the ranges based on their beginning values. NOTE: Using custom ranges disables the options on the Group Display tab.
|


